
Data exploration using Mapper
Published:
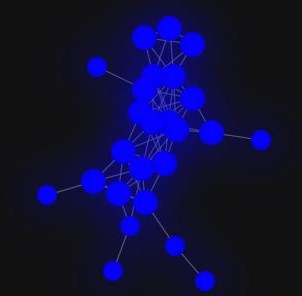
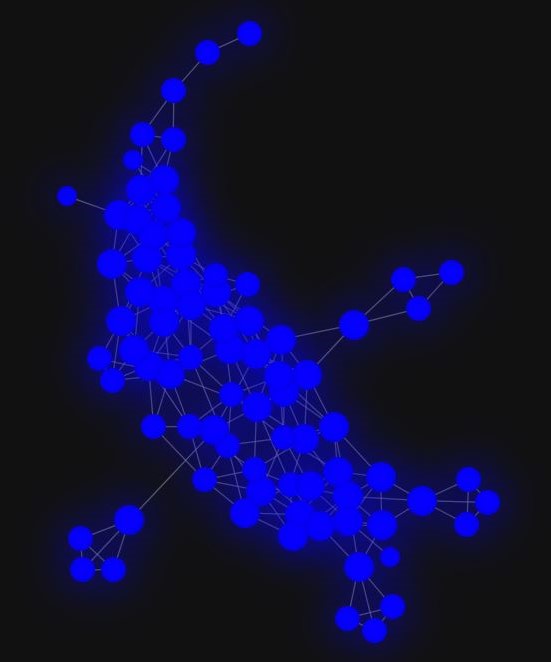
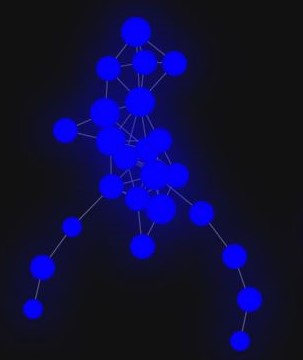
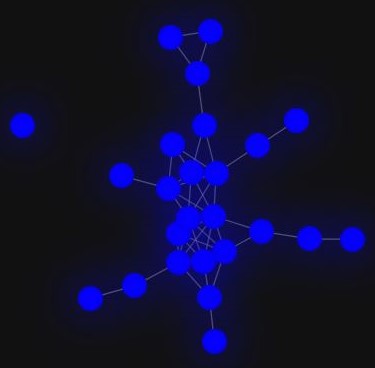
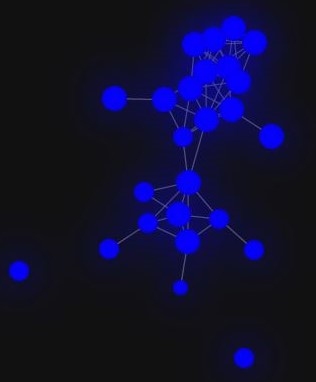
I am currently working on a paper to build a new mathematical technique for Topological Data Analysis. I used this technique to build a TDA mapper tool. This post is to give basic intuition about the mapper. Mapper is used to get a higher-level understanding of the structure of the data. It is used to visualize the shape of the data in higher dimensions. Given a mapper representation of $3$D point cloud (Points are uniformly distributed) belongs to a set of animals (horse, lion, cat, camel, elephant, flamingo). Each ball in the mapper represents a cluster and the edge between balls implies common points between corresponding clusters (intuition not definition of the mapper).
Can we identify the head or legs or tail of the animals as features in a $3$D point cloud? In Animal $1$ mapper it is not difficult to identify legs and head. Further legs are quite long compared to the rest of the body. Similarly, in Animal $5$ mapper. In Animal $2$, $6$ mappers we can identify legs, tail, and head. In Animal $6$ legs are small. Animal $3$ is obviously an elephant based on given choices whereas Animal $4$ is flamingo since I can only see $2$ legs in the mapper. Animals $1$, $2$, $5$, and $6$ are camel, lion, horse, and cat.
Mapper can be used to provide insights into high-dimensional data sets with specific patterns and data exploration purposes.
 |
|---|
| Animal 1 |
 |
| Animal 2 |
 |
| Animal 3 |
 |
| Animal 4 |
 |
| Animal 5 |
 |
| Animal 6 |